
Understanding EC and PPM: Monitoring Your Nutrient Strength
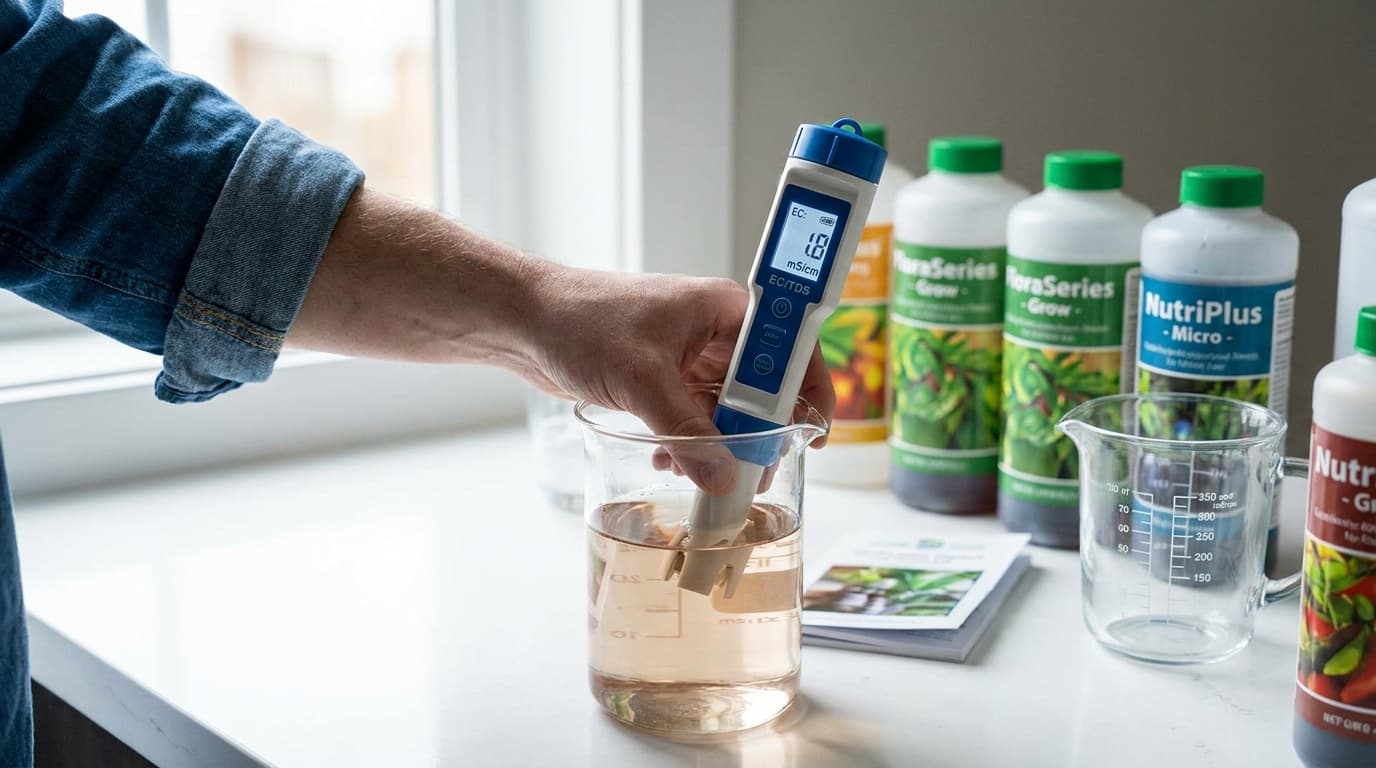
Every hydroponic grower eventually encounters the acronyms EC and PPM. These two measurements represent the single most important data point in your nutrient management strategy: the concentration of dissolved mineral salts in your water. Getting this number right determines whether your plants thrive, produce average yields, or suffer from nutrient deficiencies or toxicities. Yet despite its critical importance, EC and PPM monitoring is one of the most misunderstood aspects of hydroponic growing, clouded by conflicting conversion scales, inconsistent meter calibration standards, and widespread misinformation in online forums.
Electrical Conductivity (EC) measures the ability of your nutrient solution to conduct electricity. Pure water is an excellent insulator, but as you dissolve mineral salts into it, those salts dissociate into positively and negatively charged ions that carry electrical current. The more ions present in the solution, the higher its conductivity, and the stronger your nutrient concentration. This relationship is not perfectly linear across all concentrations and nutrient formulations, but it is consistent enough to serve as a reliable proxy for total dissolved solids in the context of hydroponic growing.
Parts Per Million (PPM) is a derived measurement that attempts to convert EC into an estimated weight concentration of dissolved solids. The problem is that different meter manufacturers use different mathematical conversion factors to perform this calculation. A single nutrient solution measured with three different PPM meters can give you three different readings, all supposedly in parts per million. This is not a manufacturing defect; it is a deliberate design choice rooted in different historical standards. Understanding these conversion scales and knowing which one your meter uses is the difference between confident nutrient management and perpetual confusion.
The Lab's Verdict on EC and PPM Monitoring
Use EC, not PPM, for all serious nutrient management. EC is a direct physical measurement with a universal scale. PPM is a calculated estimate that depends on your meter's conversion factor. If you use PPM, you must know which scale your meter uses and document it clearly. Better yet, switch to EC entirely, record your target EC values, and never worry about conversion confusion again. We also strongly recommend purchasing a meter that displays both EC and PPM simultaneously, allowing you to cross-reference and learn your preferred scale without guesswork.
EC vs PPM: What Each Measurement Actually Tells You
Electrical Conductivity is measured in Siemens per centimeter. In hydroponics, we use millisiemens per centimeter (mS/cm) or microsiemens per centimeter (uS/cm), with one mS/cm equal to one thousand uS/cm. When you dip your EC meter probe into the nutrient solution and apply a small voltage across two electrodes, the meter measures how much current flows through the solution. Higher current means more dissolved ions, which means stronger nutrient concentration. This is a direct electrical measurement with no conversion, no estimation, and no ambiguity. An EC of 1.0 mS/cm means the same thing in Australia, Canada, the United Kingdom, and Japan. The measurement is universal.
Parts Per Million, in contrast, is a weight measurement. It tells you how many milligrams of dissolved solids are present in one liter of water. The challenge is that EC meters cannot directly measure weight. They measure conductivity and then use a mathematical conversion factor to estimate PPM. This conversion factor depends on the specific salt composition of your solution, because different salts conduct electricity differently. Sodium chloride, the reference salt used in many calibration standards, conducts current very efficiently. A given weight of sodium chloride produces a much higher conductivity reading than the same weight of calcium nitrate or magnesium sulfate, which are common components of hydroponic nutrient formulations.
This means that a PPM reading of 800 on your meter may not correspond to 800 milligrams per liter of actual dissolved solids in your reservoir. It means your meter has estimated 800 ppm based on an assumption about what types of salts are in the water and how those salts conduct electricity. In practice, this assumption is close enough for routine hydroponic monitoring, but it introduces systematic error that becomes significant when you are trying to follow precise nutrient schedules from different manufacturers or when you are troubleshooting nutrient imbalances.
The Fundamental Difference
EC is a measurement. PPM is an estimate. When a nutrient manufacturer recommends a PPM target, they are assuming you are using a specific conversion scale. If your meter uses a different scale, you will mix your nutrients at the wrong strength. This is why experienced growers increasingly recommend using EC targets exclusively. EC numbers are unambiguous and transferable across any properly calibrated meter in the world.
The Three Conversion Scales: 500, 640, and 700 Explained
There are three dominant conversion scales used by PPM meters in the hydroponic industry. Every meter manufacturer chooses one of these three scales, and the scale your meter uses determines how it converts the raw EC measurement into a PPM display reading. If you do not know which scale your meter uses, you cannot reliably interpret your PPM readings, and you certainly cannot compare your readings to nutrient charts from different manufacturers or advice from other growers.
The 500 scale, also known as the TDS or NaCl scale, multiplies the EC value by 500 to obtain PPM. This scale assumes that the dissolved solids are primarily sodium chloride and that the solution conductivity follows the sodium chloride calibration curve. Meters such as the HM Digital COM-100 and many handheld TDS pens use this scale. Under the 500 scale, an EC of 1.0 mS/cm reads as 500 PPM. This scale is most common in North America and is used by many inexpensive consumer-grade meters.
The 640 scale uses a multiplier of 640 and is sometimes called the KCl scale because it is based on potassium chloride calibration. An EC of 1.0 mS/cm reads as 640 PPM on these meters. The 640 scale is commonly used by European and Australian meter manufacturers and is the default scale on many professional-grade instruments. It falls between the 500 and 700 scales, making it a reasonable compromise for general hydroponic use where the nutrient profile contains a mix of different ionic species.
The 700 scale multiplies EC by 700 and is also known as the 442 scale because it is calibrated using a 40 percent sodium sulfate, 40 percent sodium bicarbonate, and 20 percent sodium chloride salt mixture. This scale produces the highest PPM reading for a given EC value. An EC of 1.0 mS/cm shows as 700 PPM on these meters. The 700 scale is common in the aquarium and pool industries and appears on some multi-parameter meters that are used in hydroponics. The Bluelab Truncheon, one of the most popular meters in hydroponics, uses the 700 scale.
The practical consequence of these different scales is dramatic. A nutrient solution that measures 1.8 mS/cm on your EC meter could be displayed as 900 PPM on a 500-scale meter, 1152 PPM on a 640-scale meter, or 1260 PPM on a 700-scale meter. If a nutrient manufacturer recommends a target of 1000 PPM and you use a 500-scale meter, you will mix to 2.0 mS/cm. If you use a 700-scale meter, you will mix to approximately 1.43 mS/cm. These are significantly different nutrient strengths, and the difference is enough to cause deficiency symptoms or nutrient burn, depending on your crop and growth stage.
EC to PPM Conversion Reference Table
| EC (mS/cm) | PPM 500 Scale | PPM 640 Scale | PPM 700 Scale |
|---|---|---|---|
| 0.2 | 100 | 128 | 140 |
| 0.4 | 200 | 256 | 280 |
| 0.6 | 300 | 384 | 420 |
| 0.8 | 400 | 512 | 560 |
| 1.0 | 500 | 640 | 700 |
| 1.2 | 600 | 768 | 840 |
| 1.4 | 700 | 896 | 980 |
| 1.6 | 800 | 1024 | 1120 |
| 1.8 | 900 | 1152 | 1260 |
| 2.0 | 1000 | 1280 | 1400 |
| 2.2 | 1100 | 1408 | 1540 |
| 2.4 | 1200 | 1536 | 1680 |
| 2.6 | 1300 | 1664 | 1820 |
| 2.8 | 1400 | 1792 | 1960 |
| 3.0 | 1500 | 1920 | 2100 |
| 3.5 | 1750 | 2240 | 2450 |
| 4.0 | 2000 | 2560 | 2800 |
How to Measure EC and PPM Correctly: Laboratory Protocol
Accurate EC and PPM measurement requires more than just dipping a probe into your reservoir. The measurement is sensitive to temperature, probe cleanliness, sample collection technique, and the stability of the solution itself. Following a consistent measurement protocol dramatically reduces measurement error and gives you reliable data for decision making. At The Hydro Lab, we train every new grower to follow the same six-step protocol, and we recommend that all growers adopt a similar standardized approach.
First, always calibrate your meter before each measurement session. Most modern EC meters use a 1413 uS/cm calibration solution, which corresponds to an EC of 1.413 mS/cm at twenty-five degrees Celsius. Some meters also support a second calibration point using a 12.88 mS/cm solution for higher ranges. Calibrate according to the manufacturer instructions, and store your calibration solution in a sealed container away from direct sunlight. Calibration solution expires and absorbs carbon dioxide from the air, so replace it every three months or according to the manufacturer recommendations.
Second, collect a clean sample from your reservoir. Do not measure directly in the reservoir if you can avoid it, because the movement of water around the probe introduces measurement noise and the probe can be contaminated by biofilm or sediment at the bottom of the tank. Use a clean plastic cup or glass beaker to collect a representative sample from the middle of the water column, away from the water surface where evaporation concentrates nutrients, and away from the bottom where undissolved solids settle.
Third, rinse the probe with distilled or reverse osmosis water before inserting it into your sample. This prevents cross-contamination from previous measurements. Gently swirl the probe in the sample to dislodge any air bubbles from the electrode surfaces, then allow the reading to stabilize. A stable reading typically takes fifteen to thirty seconds. Record the value once it has stopped changing for at least five seconds.
EC Measurement Protocol Checklist
- 1. Calibrate meter with fresh 1413 uS/cm standard
- 2. Rinse probe with distilled or RO water
- 3. Collect sample from mid-water column in clean container
- 4. Insert probe, swirl gently to remove air bubbles
- 5. Wait 15-30 seconds for reading to stabilize
- 6. Record value and solution temperature simultaneously
- 7. Rinse probe again after measurement, store dry
- 8. Log data in your grow journal or tracking app
"The most expensive EC meter in the world will give you bad data if your measurement technique is sloppy. Consistency in measurement protocol matters more than the precision of your instrument."
Temperature Compensation: Why 25 Degrees Celsius Matters
Electrical conductivity is strongly temperature dependent. As the temperature of your nutrient solution increases, the mobility of dissolved ions increases, and the solution becomes more conductive. A nutrient solution at twenty degrees Celsius measuring 1.5 mS/cm will measure approximately 1.8 mS/cm at thirty degrees Celsius, even though the actual concentration of dissolved nutrients has not changed at all. If your meter does not compensate for this temperature effect, you will systematically overestimate your nutrient concentration on hot days and underestimate it on cold days, leading to inconsistent nutrient management throughout the growing season.
All quality EC meters include automatic temperature compensation (ATC) that adjusts the raw conductivity reading to a standard reference temperature, typically twenty-five degrees Celsius. The compensation algorithm uses a temperature coefficient of approximately two percent per degree Celsius for most hydroponic nutrient solutions. When you measure a solution at eighteen degrees Celsius, the meter calculates what the conductivity would be at twenty-five degrees and displays that compensated value. This allows you to compare readings taken at different times of day and different seasons on a consistent basis.
However, ATC is only effective when the meter's temperature sensor is accurate and in good thermal contact with the solution. Cheap meters may have slow-responding or poorly placed temperature sensors, causing compensation errors during rapid temperature changes. If you move your meter from a warm room to a cold nutrient reservoir, allow the probe to equilibrate in the solution for at least one minute before taking your reading. This gives the temperature sensor time to reach the actual solution temperature and provides accurate compensation.
It is also important to understand that ATC cannot correct for the physiological effect of temperature on your plants. Even with perfect temperature compensation, a hot nutrient solution at thirty degrees Celsius holding the same EC as a cool solution at twenty degrees Celsius is not the same from the plant perspective. At higher temperatures, plants transpire more water and take up nutrients at different rates. The effective nutrient strength experienced by the plant changes with temperature, even though the compensated EC reading remains constant. Experienced growers adjust their target EC downward as temperatures rise, reducing nutrient concentration by approximately ten to fifteen percent for every five degrees above the optimal root zone temperature.
Ideal EC Ranges by Crop: A Comprehensive Reference
| Crop | Min EC (mS/cm) | Optimal EC (mS/cm) | Max EC (mS/cm) | Notes |
|---|---|---|---|---|
| Lettuce | 0.8 | 1.2 | 1.6 | Low EC; high EC causes tip burn |
| Tomatoes | 2.0 | 2.8 | 4.0 | Increases with fruiting stage |
| Cucumbers | 1.7 | 2.5 | 3.5 | Sensitive to high EC |
| Peppers | 1.8 | 2.5 | 3.5 | Higher EC improves fruit firmness |
| Strawberries | 1.2 | 1.8 | 2.5 | Low to moderate EC |
| Basil | 1.0 | 1.6 | 2.2 | Higher EC improves flavor oils |
| Kale | 1.2 | 1.8 | 2.5 | Moderate feeder |
| Mint | 1.0 | 1.4 | 2.0 | Low EC is sufficient |
| Green Beans | 1.5 | 2.0 | 3.0 | Moderate feeder |
| Cannabis (veg) | 1.0 | 1.6 | 2.0 | Start low, increase gradually |
| Cannabis (flower) | 1.8 | 2.4 | 3.0 | Higher EC boosts resin production |
| Microgreens | 0.4 | 0.8 | 1.2 | Very low EC required |
EC Drift: Your Reservoir's Diagnostic Language
The most powerful diagnostic technique in hydroponic nutrient management is not measuring the absolute EC value, but tracking how EC changes over time between reservoir adjustments. This phenomenon, known as EC drift, tells you what is actually happening inside your nutrient solution far more reliably than any single snapshot measurement. A rising EC indicates that your plants are drinking more water than they are consuming nutrients, which means the remaining solution is becoming more concentrated. A falling EC indicates that your plants are consuming nutrients faster than they are drinking water, which means the solution is becoming weaker.
In a healthy, well-managed system, you want to see a slight EC rise between reservoir changes. This rising trend indicates that your plants are actively transpiring and growing, building new tissue from the available nutrients, and leaving behind a slightly concentrated solution. When the EC rises by approximately ten to twenty percent above your target, it is time to add fresh water to bring it back down to the desired level. This process, called top-off, replenishes the water that the plants have consumed and dilutes the remaining concentrated nutrients back to the target range.
A falling EC, in contrast, is often a warning sign. If your EC is dropping day after day, your plants are consuming nutrients aggressively but are not transpiring enough water to keep pace. This can happen during periods of rapid vegetative growth when nutrient demand is highest, but it can also indicate that your solution temperature is too warm and microbial activity is consuming nutrients, or that your plants are experiencing root problems that reduce water uptake. A sudden EC drop combined with wilting or leaf discoloration should prompt an immediate investigation of root health and system temperature.
Tracking EC drift requires consistent measurement at the same time each day, ideally shortly after the lights turn on when the system has stabilized after the night cycle. Record both the EC and the water level. By combining these two measurements, you can calculate both nutrient uptake rate and water uptake rate independently. This gives you a complete picture of your plants' resource consumption and allows you to detect problems days before visual symptoms appear on the leaves.
Six Common EC and PPM Meter Mistakes
Best Practices
- + Calibrate weekly with fresh standard solution
- + Store probe dry between uses
- + Use distilled water for rinsing only
- + Replace batteries at first sign of instability
- + Know your meter's conversion scale
- + Measure at same time daily for consistent drift tracking
Common Mistakes
- - Using expired or contaminated calibration solution
- - Measuring directly in reservoir without sample cup
- - Ignoring ATC and measuring at wrong temperature
- - Confusing PPM scales between meters
- - Not rinsing probe between measurements
- - Relying on a single reading instead of tracking drift
Frequently Asked Questions About EC and PPM Monitoring
Why does my PPM reading differ from my friend's reading of the same solution?
Your meters likely use different conversion scales. Ask your friend which scale their meter uses. If you have a 500-scale meter and they have a 700-scale meter, your reading of 800 PPM is actually the same nutrient strength as their reading of 1120 PPM. Both correspond to an EC of approximately 1.6 mS/cm. This is the single most common source of confusion in the hydroponic community.
Should I use EC or PPM for my grow journal?
Use EC. It is the universal standard and eliminates all scale confusion. Record your target EC in mS/cm for each crop and growth stage. If you must use PPM, clearly note which scale your meter uses next to every reading. A simple annotation like 800 (500 scale) prevents confusion when you review your notes months later.
How often should I calibrate my EC meter?
At minimum once per week during active use. If you are measuring multiple reservoirs or different nutrient formulations daily, calibrate before each session. Meter drift is gradual and unnoticeable during a single measurement session but accumulates significantly over weeks. A meter that was off by one percent yesterday will be off by two percent next week, and five percent within a month.
Can I use a TDS meter meant for aquariums in my hydroponic system?
You can, but with caution. Aquarium TDS meters typically use the 500 scale and are calibrated for freshwater aquariums where the dissolved solids are primarily waste products and minerals. They will give you a consistent reading in hydroponic solutions, but the absolute accuracy depends on how well the meter's calibration matches your specific nutrient formulation. A hydroponic-specific meter calibrated for the expected ionic composition of nutrient solutions will give more reliable results.
What does it mean when my EC reading drops suddenly?
A sudden EC drop typically means your plants are consuming nutrients faster than they are transpiring water. This can indicate a growth spurt, which is positive, or it can indicate root problems that are reducing water uptake while nutrient uptake continues. Check root color and smell, measure reservoir temperature, and inspect for signs of root rot. If the EC drops combined with wilting leaves, investigate your root zone immediately.
Should I adjust EC for different growth stages?
Absolutely. Seedlings and young clones need EC levels of 0.4 to 0.8 mS/cm. Vegetative plants thrive at 1.2 to 1.8 mS/cm depending on the crop. Flowering and fruiting plants require the highest EC levels, typically 1.8 to 3.0 mS/cm or higher for heavy feeders. Gradually increase EC as your plants mature, and reduce it during the final flush period before harvest to improve flavor and reduce mineral content in the harvested tissue.
Does adding pH up or down affect my EC reading?
Yes. pH adjustment solutions are concentrated acids or bases that add additional ions to your nutrient solution. Adding pH Down typically increases EC because you are adding phosphoric or nitric acid ions. A large pH adjustment can raise your EC by 0.1 to 0.3 mS/cm. Always adjust pH first, then measure EC, rather than adjusting both simultaneously. This gives you a stable baseline for nutrient strength.
Which Nutrient Monitoring Approach Fits Your Style?
Your monitoring strategy should match your personality, your schedule, and your technical comfort level. Here are three grower profiles and the approach that works best for each.
The Budget Grower
You want reliable data without spending on premium equipment. Use a basic HM Digital or Apera EC meter on the 500 scale. Stick to one crop type, learn its ideal EC range, and measure once daily. Your consistency will compensate for the lower equipment cost.
The Data-Driven Grower
You track everything and optimize continuously. Invest in a Bluelab Guardian Monitor that stays in your reservoir 24/7. Use the EC drift tracking method described in this article, log your data, and adjust nutrient concentrations based on consumption patterns. You will achieve maximum yield per gram of nutrient.
The Commercial Operator
You manage multiple reservoirs with different crops and need consistent, traceable data across your entire facility. Standardize on EC only, use a single meter model across all reservoirs, implement a weekly calibration schedule, and train all staff on the same measurement protocol. Consistency across your team is your most important quality control metric.
The Lab's Final Analysis
At The Hydro Lab, we have tested dozens of EC and PPM meters across every price point, from fifteen-dollar TDS pens to five-hundred-dollar laboratory-grade conductivity meters. Our consistent finding is that the instrument matters far less than the methodology. A cheap meter used with a strict calibration schedule and consistent measurement protocol will give you better data than an expensive meter used carelessly.
The most important step you can take today is to determine which PPM scale your current meter uses. Look up the manufacturer specifications, or better yet, measure a known calibration standard and compare the reading to the expected value. Once you know your scale, write it on the meter with a permanent marker so you never forget. If you use multiple meters, label each one clearly with its scale factor.
If you are starting fresh, skip the PPM confusion entirely and buy a meter that displays EC in mS/cm as its primary measurement. The Bluelab Truncheon remains our top recommendation for reliability and build quality, but the Apera Instruments PC60 and the HM Digital COM-100 are excellent budget-friendly alternatives. Any of these meters, used with the protocol described in this guide, will give you the data you need to manage your nutrient solution with professional-level precision.
Remember that EC measurement is not the goal; it is the tool. The goal is healthy, productive plants that deliver the yield and quality you are working for. Let your plants tell you whether your nutrient levels are correct. Use EC as your guide, but let leaf color, stem thickness, internode spacing, and overall plant vigor be your ultimate judge. A plant growing at its full genetic potential is the only meter that truly matters.
Measure consistently. Calibrate religiously. Track your drift. And when in doubt, dilute and observe. Your reservoir holds the answers if you know how to read them.
More from Nutrition & pH
Keep reading
pH and EC for Beginners: The Two Meters You Cannot Skip
What pH and electroconductivity actually measure, the targets per crop, and how to calibrate the cheap meters that everyone owns.
How to Flush Your Hydroponic System Before Harvest
Explore our comprehensive guide on How to Flush Your Hydroponic System Before Harvest. Part of our technical series on nutrient science and water chemistry, this report covers everything you need to optimize your yield and maintain a healthy grow environment.

Reading a Nutrient Deficiency Chart Like a Plant Doctor
Yellow leaves, purple stems, twisted tips — a structured way to diagnose the 12 most common deficiencies.